Published Jul 19, 2023 | 11:00 AM ⚊ Updated Jul 20, 2023 | 8:17 AM


Multidimensional Poverty Index shows poverty in South India has reduced. (Creative Commons)

Ernakulam district in Kerala has achieved the envious status of becoming India’s first district to eradicate poverty, while poverty in Chennai has increased in the last four years, according to Niti Aayog’s latest “National Multidimensional Poverty Index — A Progress Review 2023“.
The report highlights that a significant number of Indians, around 13.5 crore people, have escaped multidimensional poverty. It also indicates that South Indian states have the lowest poverty rates among the regions analysed.
Kerala emerges as the least poor state in the country, followed by Tamil Nadu in third place. Telangana secures eighth position, Andhra Pradesh ninth, and Karnataka 11th.
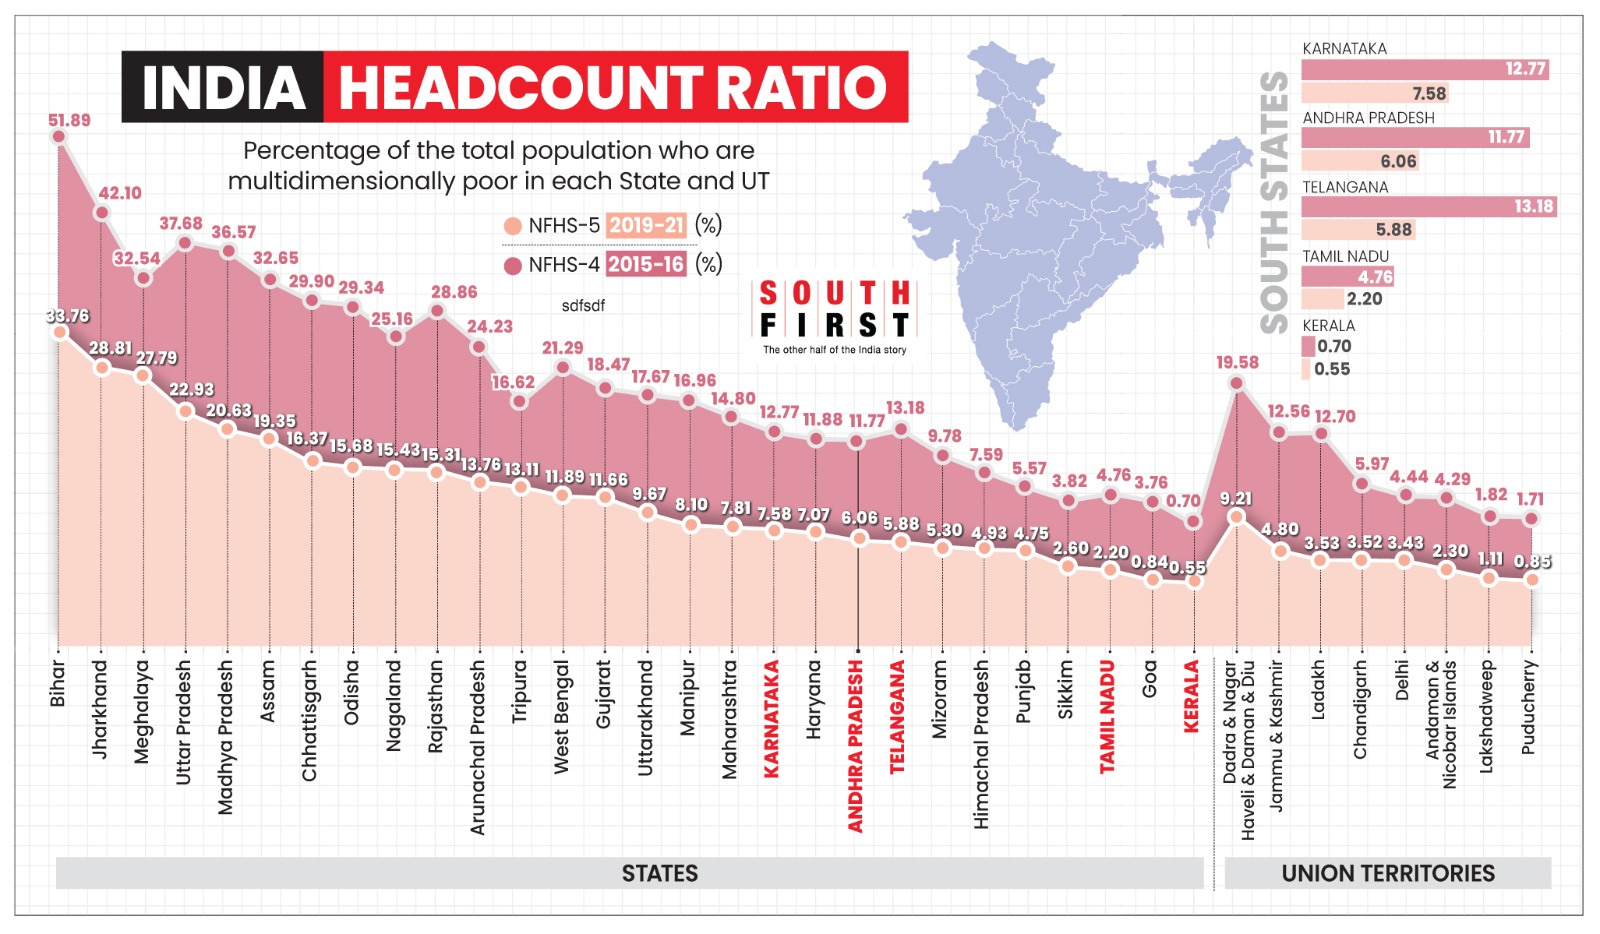 The second edition of the National Multidimensional Poverty Index (MPI) report states that the country as a whole experienced a decline of 9.89 percentage points in poverty, dropping from 24.85 percent in 2015-16 to 14.96 percent in 2019-2021.
The report shows that rural areas witnessed the most significant reduction in poverty, decreasing from 32.59 percent to 19.28 percent. In urban areas, the poverty rate decreased from 8.65 percent to 5.27 percent.
On the other hand, several North Indian states, including Uttar Pradesh, Bihar, Madhya Pradesh, Odisha, and Rajasthan, registered the most substantial decline in multidimensional poverty.
Multidimensional poverty recognises that poverty is a complex phenomenon influenced by various interrelated factors and deprivations that extend beyond mere income.
The MPI looks at three main dimensions: Health, education, and living standards. Under these dimensions, various indicators are examined, such as nutrition, child mortality, years of schooling, access to clean water, sanitation, electricity, cooking fuel, and assets.
Kerala ranked first with least number poverty amongst its people.
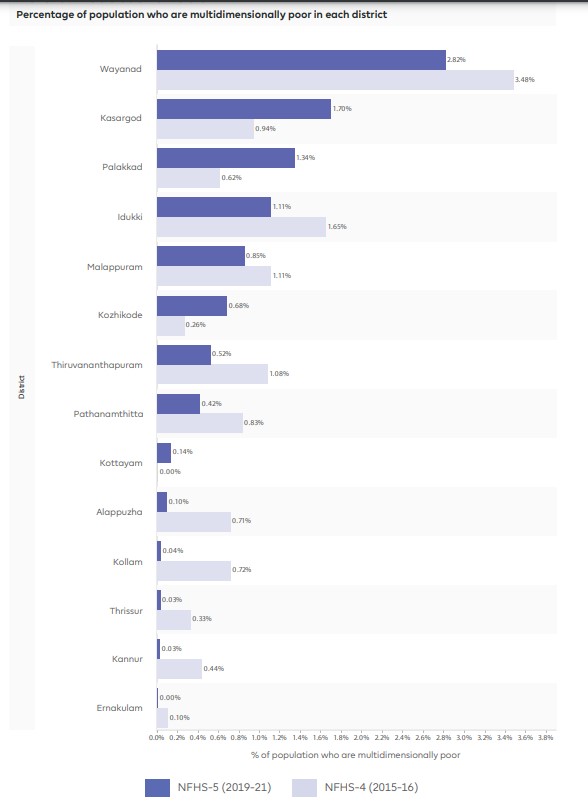
Percentage of population that is multidimensionally poor in each district in Kerala. (NITI Aayog)
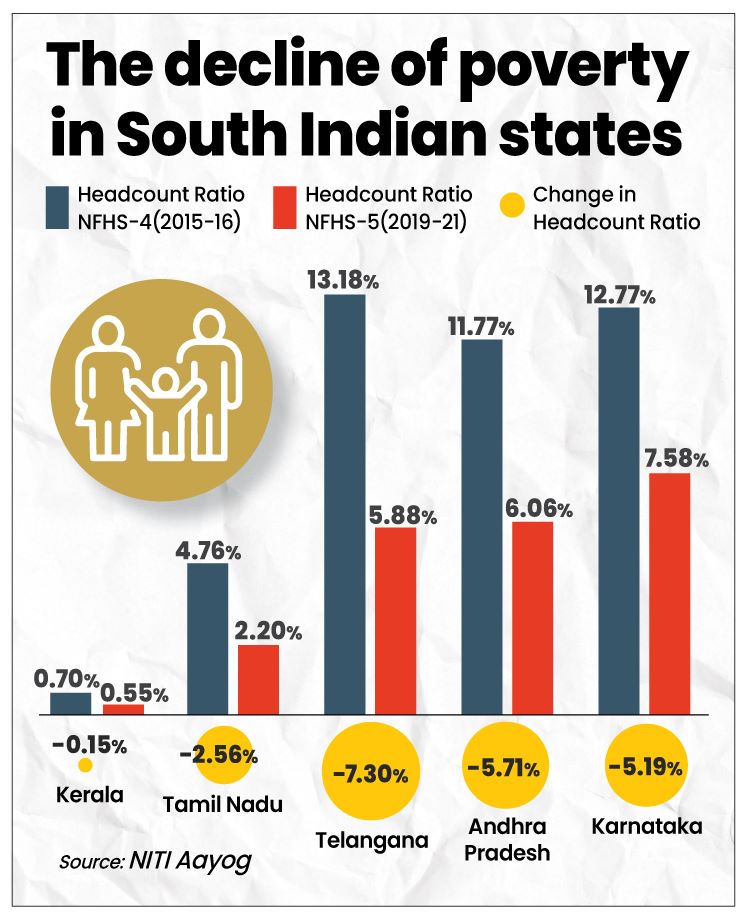
The state has experienced a decrease of -0.15 percent in the headcount ratio between 2015-15 and 2019-21, according to the report.
The percentage of the total population in Kerala living in multidimensional poverty declined from 0.77 percent in 2015-16 to 0.55 percent in 2019-21, resulting in an estimated 53,239 people escaping poverty in the state.
However, the state witnessed a negative impact on several fronts: For one, the number of people with poor nutritional status rose from 15.29 percent in 2014-15 to 16.44 percent.
On the maternal health front, the number rose from from 1.73 percent to 3.30 percent. The number of households where children aged 10 years or older have not completed six years of schooling rose from 1.78 percent to 2.49 percent.
Also, household with inadequate housing increased from 10.76 percent to 16.67 percent.
Ernakulam district has eliminated poverty: In 2014-15, the district had 0.10 percent poverty while 0 percent of the population was poverty-stricken in 2019-21.
Tamil Nadu, ranked third, experienced a decrease of 2.56 percent in the headcount ratio between 2015-15 and 2019-21, according to the report.
The percentage of the total population in Tamil Nadu living in multidimensional poverty declined from 4.76 percent in 2015-16 to 2.20 percent in 2019-21, resulting in an estimated 19,58,454 people escaping poverty in the state.
Pudukkottai (4.63 percent), Dindigul (4.52 percent), and Sivaganga (3.96 percent) were identified as the poorest districts, while Kanniyakumari (0.67 percent), Coimbatore (0.96 percent), and Chennai (1.03 percent) were the least impoverished districts.
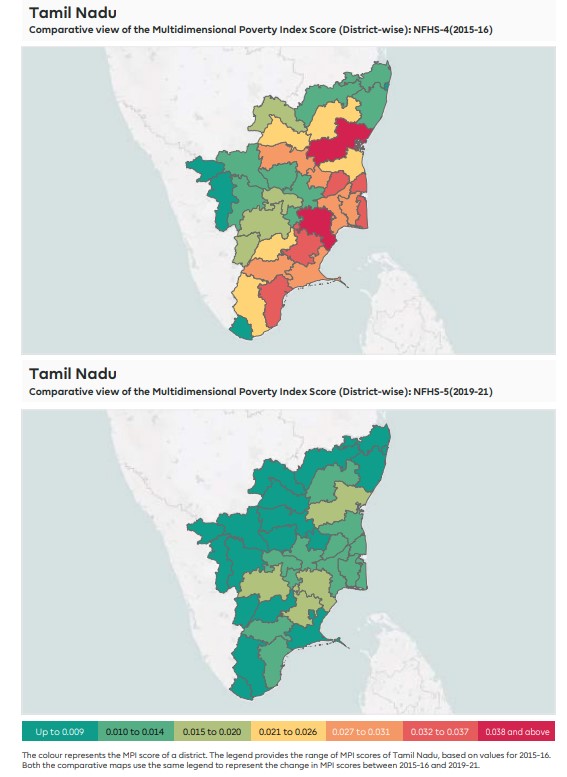
Comparative view of the Multidimensional Poverty Index Score. (NITI Aayog)
Tamil Nadu witnessed a negative impact on the years of schooling indicator, with the percentage of the population deprived of education increasing to 8.53 percent as per the 2019-21 National Family Health Survey (NFHS-5), compared to 6.61 percent in the 2015-16 NFHS-4.
Chennai district also experienced an increase in the MPI, with the number rising from 0.93 percent in 2015-16 to 1.03 percent in 2019-21.
The Tamil Nadu State Planning Commission has stated that the estimation of MPI based on NFHS data has problems as the survey was not conducted specifically for MPI estimation.
“We should be aware that the NFHS data collected for a different purpose constrains the estimation of ‘real’ MPI as the survey precedes the ideation of MPI — in other words, the data is not collected for the purpose of estimating MPI. As such, the estimation of MPI is determined by the available information rather than the required information,” the State Planning Commission said in 2022 about determining MPI based on NFHS data.
It had further said that Tamil Nadu is known for being proactive in providing housing and public utilities like drinking water and electricity to all households.
“Surveys like these either underestimate the spread of access to services… Rather there may be location-specific indicators of other deprivations which need to be included in poverty estimations. Given the wide variation in development indicators across sectors in different states, the poverty estimation based on a common set of data conceals more than what it reveals about deprivations in different regions,” said the commission.
Telangana, ranked 8th, saw a 7.3 percent reduction in the population living in multidimensional poverty between 2015-16 and 2019-21.
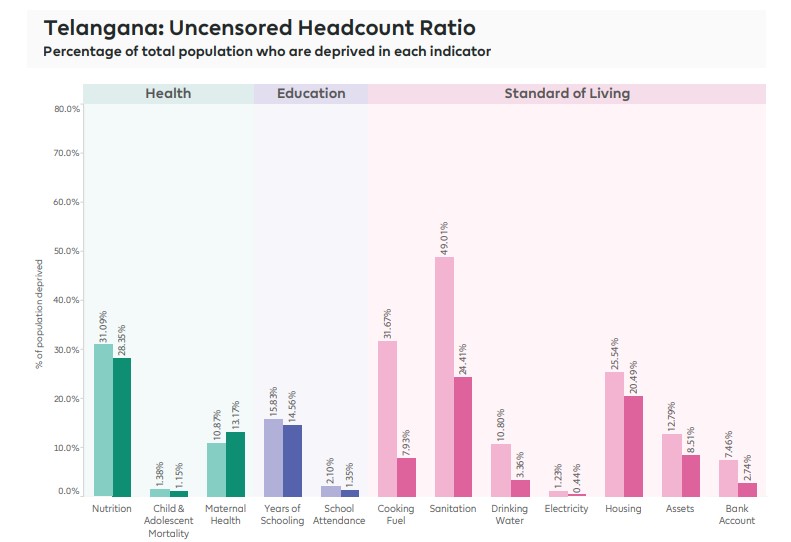
Telangana Percentage of total population who are deprived in each indicator. (NITI Aayog)
The percentage of Telangana’s total population living in multidimensional poverty declined from 13.18 percent in 2015-16 to 5.88 percent in 2019-21, with an estimated 27,61,201 people escaping poverty in the state.
Among districts, Kumaram Bheem Asifabad (16.59 percent), Jogulamba Gadwal (15.37 percent), Adilabad (14.24 percent), Vikarabad (12.5 percent), Kamareddy (11.9 percent), and Mahabubnagar (10.27 percent) had the highest percentage of multidimensionally poor population as per NFHS-5.
Peddapalli (2.17 percent), Hanmakonda (2.41 percent), Karimnagar (2.5 percent), Hyderabad (2.52 percent), and Jangaon (2.91 percent) had the lowest percentage of multidimensionally poor population.
However, Telangana showed a negative impact on the indicator of maternal health, with the percentage of the population deprived of it increasing from 10.87 percent in 2015-16 (NFHS-4) to 13.17 percent in 2019-21 (NFHS-5).
Andhra Pradesh, ranked 9th, witnessed a 5.71 percent reduction in multidimensional poverty from 2015-16 to 2019-2021, according to the NITI Aayog report.
The state’s poverty rate dropped from 11.77 percent in 2015-16 to 6.06 percent in 2019-2021, with an estimated 30,19,718 people escaping poverty.
The indicator for maternal health in Andhra Pradesh, however, saw a negative impact, with the percentage of the population deprived of it increasing from 9.66 percent in 2015-16 (NFHS-4) to 10.77 percent in 2019-21 (NFHS-5).
 Kurnool had the highest multidimensional poverty rate of 19.64 percent in 2015-16, which decreased to 12.84 percent in 2019-21. Vizianagaram witnessed a drop from 19 percent to 8.66 percent, while Visakhapatnam’s poverty rate decreased from 15.10 percent to 7.6 percent.
West Godavari district had the lowest poverty rate at 2.42 percent.
NITI Aayog appreciated Andhra Pradesh for conducting its own surveys to determine MPI and encouraged other states to pursue analysis at multiple levels.
“NITI Aayog continues to encourage states to pursue analysis at multiple levels. This can be achieved by designing and conducting household surveys to estimate MPI at the block or district levels with higher frequency. Such surveys provide insights into block-level estimates, which are not possible with NFHS due to its sample design and size.
“A good example of this is the initiative taken by the Government of Andhra Pradesh, which conducted a household survey in 2016 exclusively to estimate MPI at the state and district levels,” said NITI Aayog.
It should be mentioned that in its Socio-Economic Survey, the state has appreciated the NFHS data for determining MPI. It has mentioned that the poverty ratio measured hitherto has one dimension — Income/Consumption.
The people who do not have sufficient income to cover the defined basket of goods and services were considered poor.
However, Poverty, as defined by those who are poor include the lack of education, health and standard of living (as measured by housing, employment, assets, drinking water, sanitation, etc).
“Thus MPI, as a measure which explores poverty beyond income deprivations, is a tool for policymakers working for SDG 2030 agenda,” reads the Socio-Economic Survey 2022-23 of the state.
Karnataka, ranked 11th, experienced a decrease of 5.71 percent in MPI from 12.77 percent in 2015-16 to 7.8 percent in 2019-21. The state saw 34,87,223 people emerge from poverty according to the NITI Aayog report.
Yadgir (25.38 percent), Raichur (20.19 percent), and Kalaburagi (18.63 percent) were identified as the poorest districts, while Ramanagara (0.88 percent), Bengaluru Rural (0.99 percent), and Bengaluru Urban (1.47 percent) were the least impoverished districts.
Karnataka was commended for establishing the State Institute for Transformation of Karnataka (SITK), which included domain experts as advisers covering various fields relevant to poverty alleviation.
The National MPI measures simultaneous deprivations across three equally weighted dimensions of health, education, and standard of living that are represented by 12 UN Sustainable Development Goals (SDG)-aligned indicators.
These include nutrition, child and adolescent mortality, maternal health, years of schooling, school attendance, cooking fuel, sanitation, drinking water, electricity, housing, assets, and bank accounts.
All 12 indicators showed marked improvement, the Niti Aayog said, adding that the report followed the Alkire-Foster methodology developed by its technical partners — the Oxford Poverty and Human Development Initiative (OPHI) and the United Nations Development Programme (UNDP).
Based on the latest National Family Heath Survey [NFHS-5 (2019-21)], the second edition of the national MPI represented India’s progress in reducing MDP between the two surveys, NFHS-4 (2015-16) and NFHS-5 (2019-21).
The report builds on the baseline report of India’s National MPI launched in November 2021.
According to the latest global MPI update released by the UNDP and OPHI, a total of 415 million people moved out of poverty in India within just 15 years from 2005/2006 to 2019/2021.
The Niti Aayog report attributed the decline in poverty to the government’s dedicated focus on improving access to sanitation, nutrition, cooking fuel, financial inclusion, drinking water, and electricity.
Between 2015-16 and 2019-21, the MPI value nearly halved from 0.117 to 0.066 and the intensity of poverty reduced from 47 percent to 44 percent.
India is on the path of achieving the SDG Target 1.2 (of reducing multidimensional poverty by at least half) much ahead of the stipulated deadline of 2030, Niti Aayog CEO BVR Subrahmanyam said.
