

Published Sep 03, 2026 | 9:15 AM ⚊ Updated Sep 15, 2026 | 11:22 AM

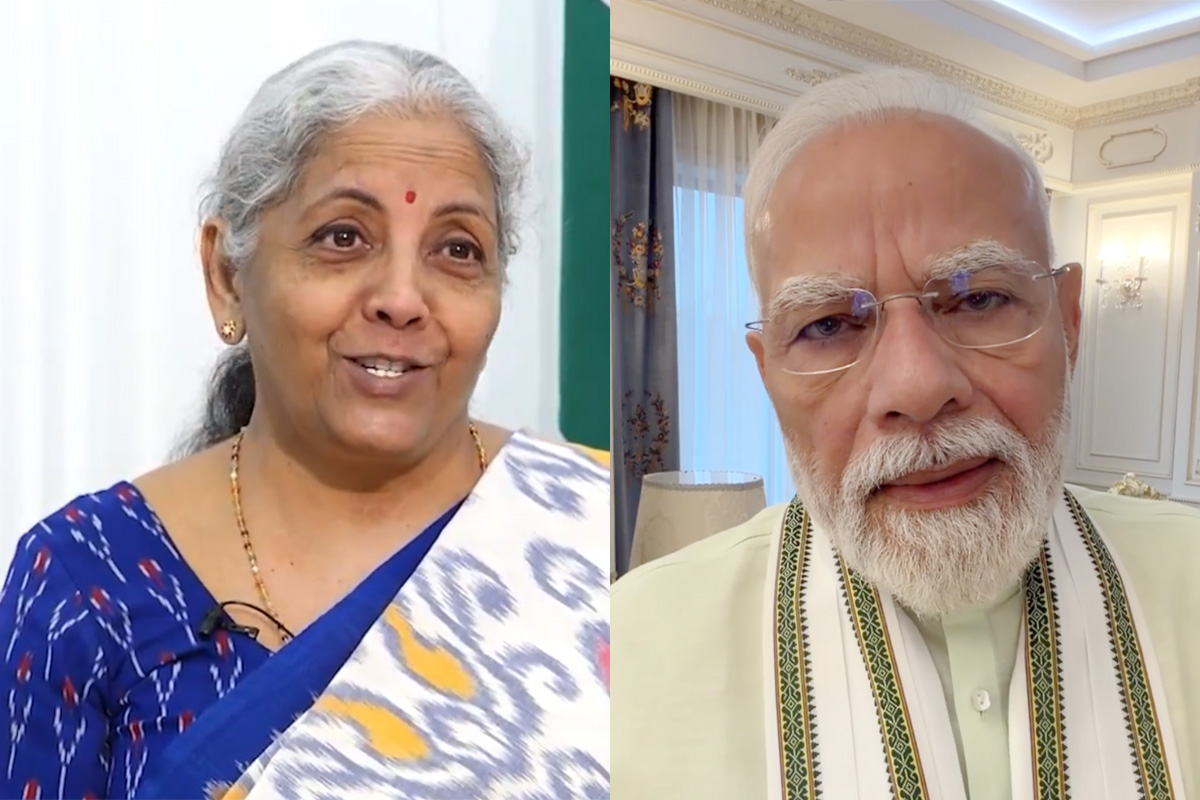
Finance Minister Nirmala Sitharaman and Prime Minister Narendra Modi.

Synopsis: While former Finance Secretary Subhash Chandra Garg should not have compared the current and old GDP series—an apples-to-oranges comparison—his larger question about India’s latest GDP numbers is legitimate. After all, a systematic downward revision across several years naturally raises questions.
Is India’s true GDP growth in the first quarter only 2.6% and not 7.8% as claimed by the government? Are the government statisticians guilty of massaging numbers?
On Tuesday, when Prime Minister Narendra Modi and Finance Minister Nirmala Sitharaman released videos patting themselves and the nation on the back for the “herculean feat“, this reality check emerged from a man who had served as Finance Secretary under Ms Sitharaman and the PM.
Subhash Chandra Garg, in his commentary on the August release of GDP estimates for Q1, stated that there are large differences in Q1 nominal numbers between the old series (Base 2011-12) and the new one (released on February 27, 2026, with Base Year 2022-23).
A day later, he took to X to “explain the analytical basis of my conclusion that GDP growth in Q1 2026-27 in current prices is 2.6% and in real terms close to zero. There are still messier distortions in sectoral performance, with manufacturing and consumption witnessing negative growth”. His supporting evidence was the link to an article behind a paywall that appeared on The Quint.
Pawan Khera, Chairman, Media and Publicity Department, AICC, made it a point to note that Garg’s main “contention is even more damning: the previous year’s GDP growth was revised downward, making this year’s growth rate look stronger by comparison.”
Garg had drawn attention to the fact that Q1 FY2025-26 had been revised from 7.8% to 6.9%.
“I’m saying that by revising last year’s GDP by as much as 6 trillion rupees, the current year’s GDP in the first quarter has gone up by about 10.3 per cent,” Garg told an Adani-backed TV channel.
In effect, Garg was alleging that a Swadeshi fairytale had been cooked in government kitchens and served by the Ministry of Statistics and Programme Implementation (MoSPI) and Press Information Bureau (PIB).
While Garg should not have compared the current and the old series—an apples-to-oranges comparison—the larger question on its own is legitimate.
What the new series shows is that the estimated size of the Indian economy was smaller than what was projected under the old series. The table below shows that the Indian economy was smaller by 3% across all the years.
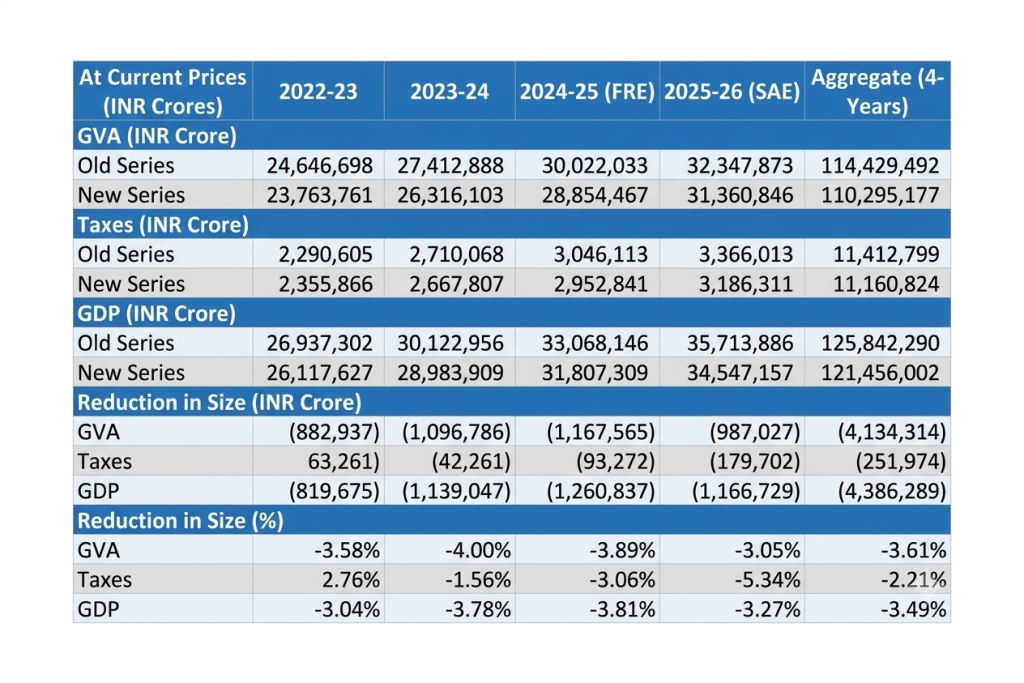
If we put it in absolute numbers, the size of the Indian economy with the new series is smaller by ₹43.86 lakh crore for four years put together, with annual numbers ranging between ₹8.2 lakh crore and ₹12.6 lakh crore.
Some of the biggest variations (greater than 3%) have been in private consumption expenditure (highlighted in pink cells) in the Table below. On the other hand, government expenditure, fixed capital formation, and exports have experienced positive variations, but much smaller than private consumption expenditure (highlighted through green cells in the Table). At the same time, the variation has been widespread across quarters.
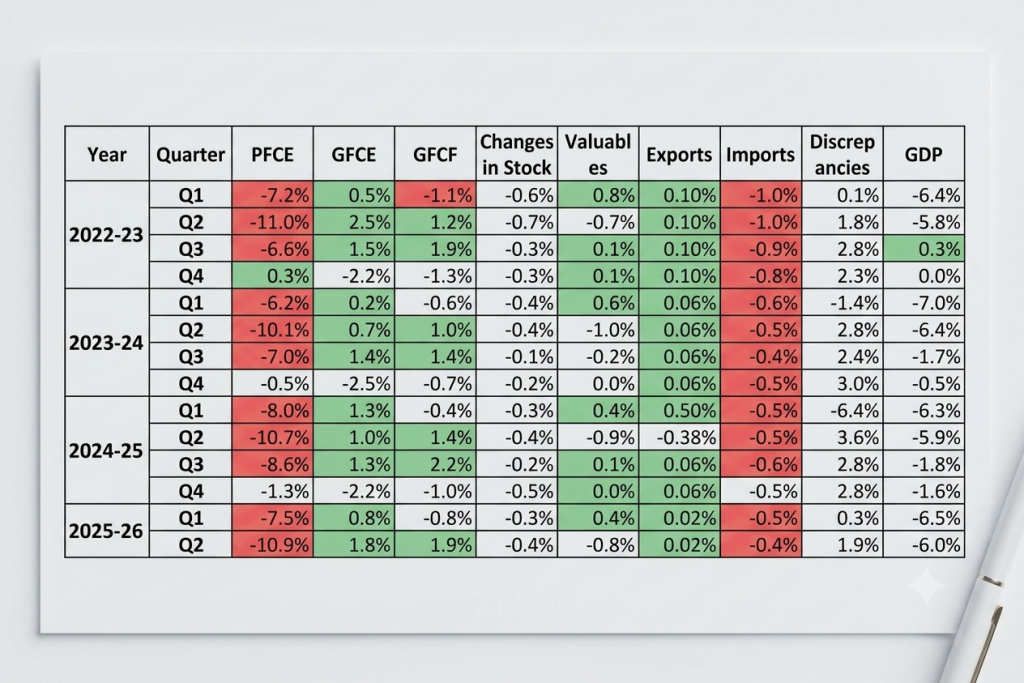
Assuming that the new series is a better representation of the economy, we have had large estimation errors for a long time. It is an issue that did not get enough attention at the time of release of the new series in June.
MoSPI and PIB releases suggest that the reduction in nominal size is largely driven by changes in proxy indicators for economic activity. We will know the real reason only when MoSPI releases detailed explanations to determine if it was poor data, inaccurate coverage or the proxy indicators.
We do need that explanation, as the economic decisions by businesses or households were based on earlier numbers that overestimated the size of the Indian economy. A revision does not have to be an error.
We, however, need to worry about the magnitude of revisions (3% is large), revision bias (only downward), revision frequency (after more than a decade), and predictability of revisions (no one really anticipated these revisions). A one-off revision is understandable, but a systematic downward revision across several years naturally raises questions.
We do see some minor revisions even between June and August releases for Q1 GDP estimates, as seen in the Table below, but the extent of variation is not as much as those between the old and the new series. Private consumption still shows significant variation in the two estimates.
It is, therefore, important for MoSPI to help businesses and households to know the real size of the Indian economy, which is far more important than allowing politicians to sell their narratives.
It will be helpful if MoSPI could provide a table titled “Sources of Revision in Nominal GDP Levels: FY23-FY26“, with contributions from ASUSE (Annual Survey of Unincorporated Sector Enterprises), GST (Goods and Services Tax) integration, SUT (Supply and Use Tables) balancing, sectoral reclassification, and other methodological changes. Until then, you can’t blame people if people ask questions.
Also Read:
In cold numbers: What brought the youth to Jantar Mantar and the streets of India
India in 2050: The world’s second-largest economy—and its hundredth-poorest nation
No, India’s ‘great’ Global Capability Centres aren’t transformational yet
(Edited by R Rajesh Kumar.)



