
Published Jul 31, 2026 | 7:00 AM ⚊ Updated Jul 31, 2026 | 7:00 AM

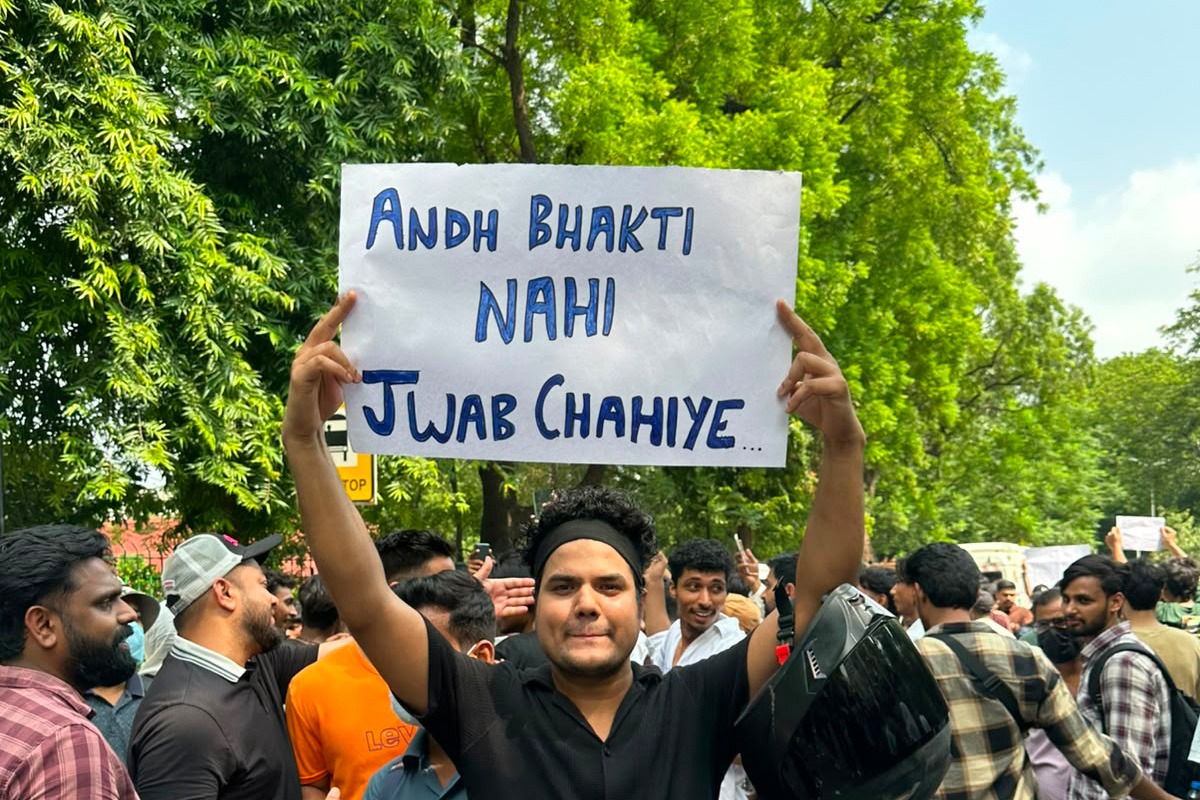
A poster that says it all from Jantar Mantar. (Photo | Likhitha Nair)

Synopsis: The youth protests that culminated in the resignation of Dharmendra Pradhan on July 25 were a seminal event. What drove this outburst from a generation till recently seen as being glued to their phones and generally indifferent? An attempt to find the answers in five tables whose numbers tell the tale louder than words possibly ever will…
In 40 years, the level of unemployment among under-25 youth who are graduates has grown by four per cent to almost 40%, according to the State of Working India 2026 report released by the Azim Premji University. That damning headline number alone captures why our young came out in such numbers onto the streets to protest and force the resignation of Education Minister Dharmendra Pradhan.
Out of roughly 63 million graduates in the age group 20–29, almost 11 million are unemployed. The report also captures that 67% of the unemployed youth today are graduates. This compares to roughly 32% of them being out of jobs in 2004. And remember, higher education is turning prohibitively costly for most. In the midst of all this come the exam failures like NEET 2026.
The bigger message, then, is that leaders cannot deal in platitudes alone, dispensing official stats that hide more than they reveal as opiates. The young know the fight they are in and need answers. The government has to work towards hearing them and addressing their woes.
Our current official statistics inform us that India’s employment level has grown at a CAGR of about 5.2% since 2018 (going up from 475 million to 643 million in 2024, based on the KLEMS report), which is five times the annual growth in our population. If we read this information together with the level of growth (9.2%) in economic output (Gross Value Added at Current Prices), our Gross Value Added per employed person has grown at a Compound Annual Growth Rate of 4%. It can be considered a reasonable performance if we compare ourselves with other large economies–a comparison that we often hear from our public officials and the business economists.
But the significance of being the world’s fastest-growing major economy must ultimately be assessed in the context of India’s status as a lower-middle-income country. A late-developing economy like ours is expected to experience rapid productivity and income convergence, and employment expansion alone is not sufficient.
Also Read | Withdrawing consent: Gene Sharp and the Cockroach uprising
All large economies have a much higher per capita income and output per employed person in purchasing power as well as nominal terms. We have come close to their worker-to-participation ratios, but without a corresponding increase in output per employed person, which means that our workers are engaged in low-value-adding activities.
At our stage of development, we should be experiencing much higher growth in output per worker, as the quality of our consumption should be going up at a much higher pace, along with the growth in volume.
Some of the questions that we need to ask are:
The recently released State of Working India 2026 report suggests that the “transition into employment remains uncertain and difficult” for our young. It also highlights the fact that educational attainment has improved significantly without a major shift in the quality of employment, as 40 million of 83 million jobs created between 2021-22 and 2023-24 were in agriculture.
We do know that agriculture has continued to be a low-value-adding activity even when the area under cultivation and yields have improved over the years. We also know that the farmers are not to be blamed for their plight, as our MSP-based pricing policy does not even cover the true cost of farming.
The State of Working India report also states that there has been a reversal in tertiary enrollment trends among men, with their share in enrollment falling from 38% in 2017 to 34% in late 2024. A large proportion of people cited “the need to support household incomes as a reason for their withdrawal”. The report mentions that the share of these people has increased to 72 per cent by 2023, from 58 per cent in 2017.
We do know that an economy that does not invest in higher education limits the ability to make economic as well as social progress. Higher education is expected to help families earn better and build their ability to take risks.
However, stagnant real wages for blue- as well as white-collar workers for many years and large-scale workforce reduction in IT and many new-age businesses are possibly one of the reasons for families staying away from investment in education. Education cost inflation is, of course, the other. We continue to experience high graduate unemployment, as we discuss later.
For many households, the rising cost of education, stagnant earnings, and uncertain labour-market outcomes are increasing the financial risks associated with higher education. Consequently, we run the risk of education becoming a financial decision and not an economic necessity for most families.
We experienced a significant upswing in employment levels between 2018 and 2022, though largely driven by growth in rural employment. However, we have not been able to sustain even that momentum. Consequently, the unemployment level, particularly for our young, has remained nearly constant.
Table 1: Work Population Ratio (Employed Persons/Population)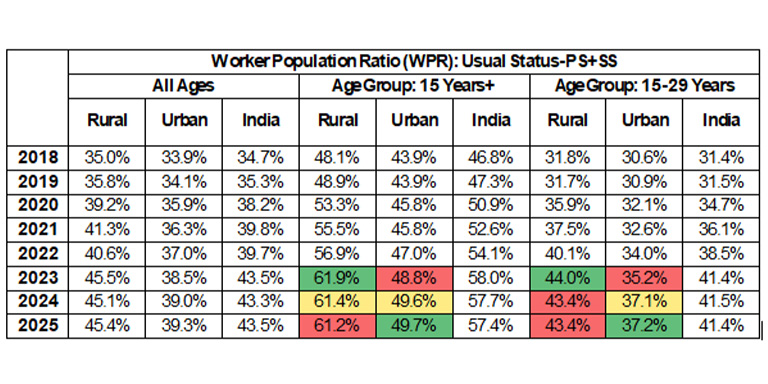
As we see in Table 1 above, the rural population has been the worst affected during the last three years, with Work Population Ratios there falling from 61.9% to 61.2% for the 15 years+ age group and from 44.0% to 43.4% for the 15-29 years age group. While there has been some improvement for the urban youth (Work Population Ratios going up from 35.2% to 37.2%), the current level of participation itself is very low.
Last year’s PLFS Survey (Calendar Year 2025) shows that 25% of our young (15-29 Years) are Not in Employment, Education or Training (NEET). As for the graduates in urban areas, the NEET level is even higher at 27.8%.
Self-employment has been the main driver of the Labour Force Participation Rate during the last decade, with only a minor change in regular-wage employment. During the same period, there has been a decline in people engaged as casual labour, with that level of decline being close to the increase in self-employment. At the aggregate level, the rise in self-employment appears largely to have offset the decline in casual labour. While urban regular-wage employment has always been higher than the rural level, the level (of urban regular-wage employment) has barely increased during the last decade.
Table 2: Labour Force Participation Rate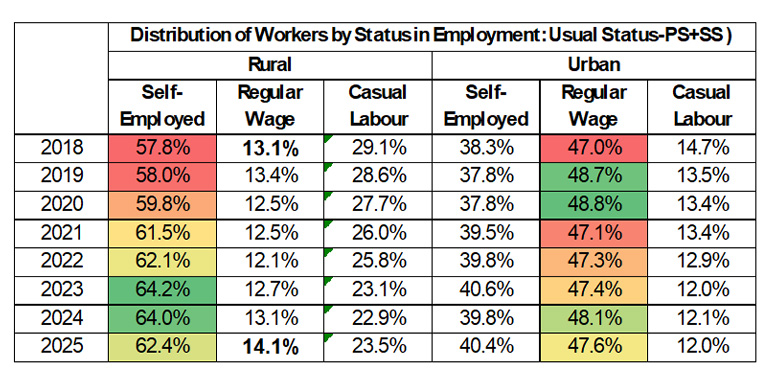
An urban self-employed male’s monthly gross earnings were Rs 26,094 in 2025, with the female self-employed earning just Rs 10,237, which is 39.2% of a male’s gross earnings.
Table 3: Average Earnings by Status of Employment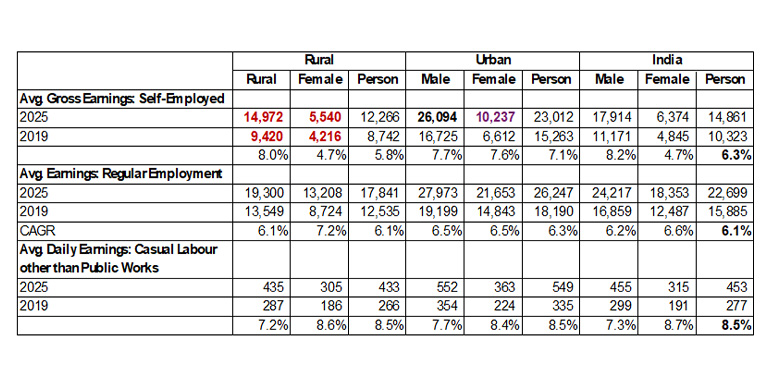
We must also recognise that a self-employed male’s average gross earnings are just 28% higher than the average per capita GDP of Rs 20,317. Net earnings (after adjusting for the business-related costs) will, of course, be lower than the per capita GDP in most cases.
Given the fact that 56.2% of India’s workforce is self-employed and its monthly gross earnings are just Rs. 14,861, we can neither be a great consumption nor a great investment economy.
Not only are the monthly gross earnings of self-employed people low, but they have also been growing at a low rate – an annual rate of 6.3%, which is far lower than the GDP growth, which was about 9.8% during the last decade.
Rural self-employed persons (male or female) earn far less than urban self-employed persons (Table 3). For example, the gross earnings for rural self-employed men are 57.4% of urban men’s earnings and for a rural woman just 54.1% of her urban counterpart.
People engaged in regular wage employment earn better (Rs. 22,699) than the self-employed, but their wages too have grown only at 6.1% per annum since 2018.
Even if we assume that both male and female members of an urban family are self-employed or employed with regular wages, the monthly family gross income adds to Rs 36,331 for self-employed and Rs 49,625 (monthly income) for the family engaged in regular wage employment. With these incomes and the current cost of living in urban India, there is very low probability of these families being able to invest in upgrading their skills or sending their children to good schools and colleges for higher education.
Given that the rural families earn much less (Rs 20,512 of gross earnings for self-employed and Rs 32,509 for families engaged in regular wage employment), they have even fewer chances of being able to invest in themselves or their children.
Another fact needs to be emphasised. A large proportion of our self-employed are in agriculture and other low-value-adding activities in trade, accommodation and food services. A self-employed person in agriculture has to deal with much higher uncertainty and has no bargaining power within or outside the agriculture value chain. It is, therefore, not surprising that an average agriculture-dependent family is indebted and has limited money to invest in its future.
Table 4: Status of Employment by Sector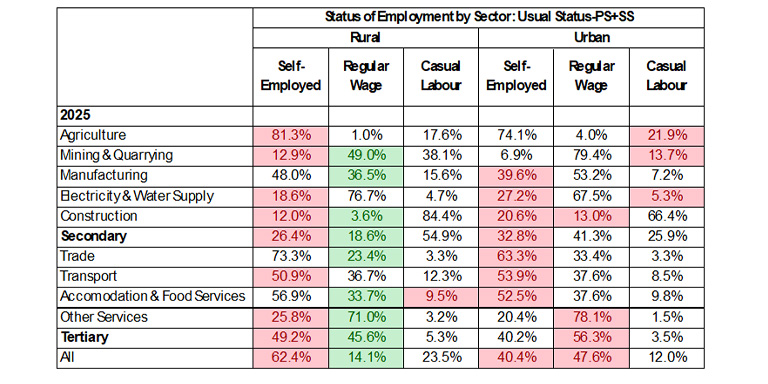
Self-employment for 56.2% of the workforce with low earnings that are growing at rates lower than the growth in GDP is not going to help us become a developed country anytime soon.
Our reported aggregate unemployment level of 3.1% has no value in informing us about the nature of the problem that we face and the policy choices that we must make. It, in fact, indicates that we are at full employment level and have nothing to worry about. Similarly, the reported youth unemployment level at 9.9% looks reassuring. But dive underneath and the labour-market challenges facing our young remain serious and persistent.
As mentioned at the beginning, the State of Working India report informs us that the unemployment level for youth below 25 years of age with a graduate degree and above was 39.33% in 2023, which is higher than 35.02% in 1983.
The opportunities for graduates between 25 and 29 years of age are worse, as the level of unemployment has increased from 12.15% to 20.04% for them.
Table 5: Unemployment Level by Level of Education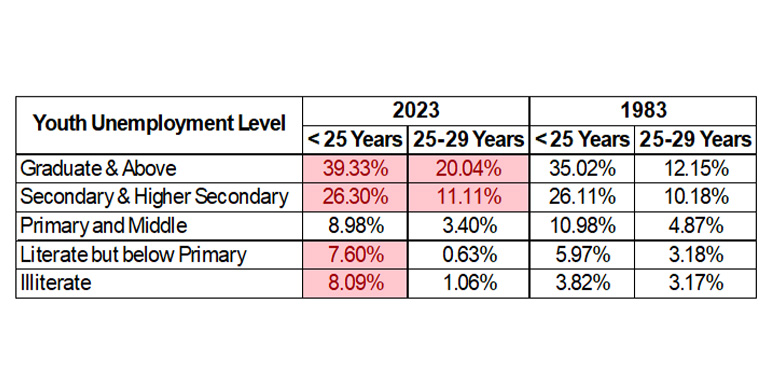
We also know that it has been difficult to absorb even the engineering and management graduates in the Indian economy during recent years.
We are doing better only for groups with lower education, particularly primary and middle school education. It is, therefore, not surprising that the enrollment rates for men in tertiary education are declining and our output per employed person has not been going up as much as required at this stage of our development.
In summary, we must focus on creating greater employment that is productive, stable, scalable and accompanied by increasing earnings and economic and financial security. While a segment of self-employment represents entrepreneurial activity capable of generating innovation and employment, our most important concern arises because the level of aggregate earnings suggests that a large share of self-employment remains concentrated in low-productivity activities.
Self-employment in agriculture or low-value-adding services is not going to take us too far in realising our vision of being a developed country.
Also Read:
‘It’s the economy, stupid’: The making of India’s Gen Z discontent
India in 2050: The world’s second-largest economy—and its hundredth-poorest nation
(Edited by R Rajesh Kumar.)



