

Published Sep 10, 2026 | 9:15 AM ⚊ Updated Sep 10, 2026 | 9:15 AM

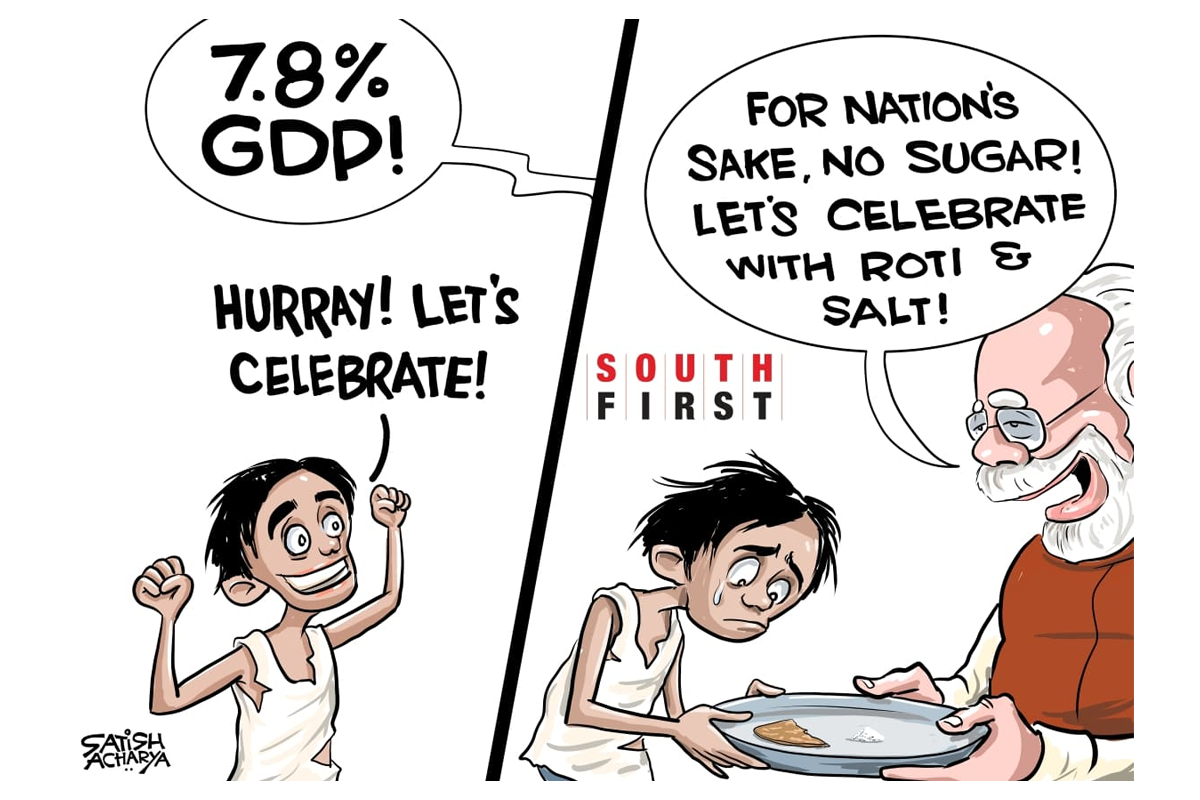

Synopsis: The revised GDP series may be telling us more than that India’s economy is smaller than previously estimated: it may be revealing a more capital-intensive economy, with more output absorbed by intermediate inputs and capital consumption. The most important task now is not to defend or criticise the latest revision, but to explain what it says about how India’s economy has changed.
An earlier article on South First had outlined the drivers of the decline in GDP estimated by the new series.
The consistent decline in personal consumption expenditure and imports, alongside increases in government consumption and exports and discrepancies, were highlighted there. The suggestion was that the Ministry of Statistics and Program Implementation (MOSPI) must reconcile the GDP estimates and share the details with the public as a matter of priority, given the consistently large downward revisions across successive years.
The next step is to review the production-side data and identify the possible drivers for differences in the old and new series.
One of the often-made arguments during the recent debate is that the old series overestimated the informal sector’s contribution. The new series also draws on expanded administrative data and revised estimation methods, which are expected to improve coverage and measurement. But improved methods do not, by themselves, explain the economic meaning of the resulting revisions.
Here, the National Accounts Statistics data released on August 31, 2026, is being used to examine both the accounting sources of the downward revision and the possible changes in India’s economic structure that the new series may be capturing more fully.
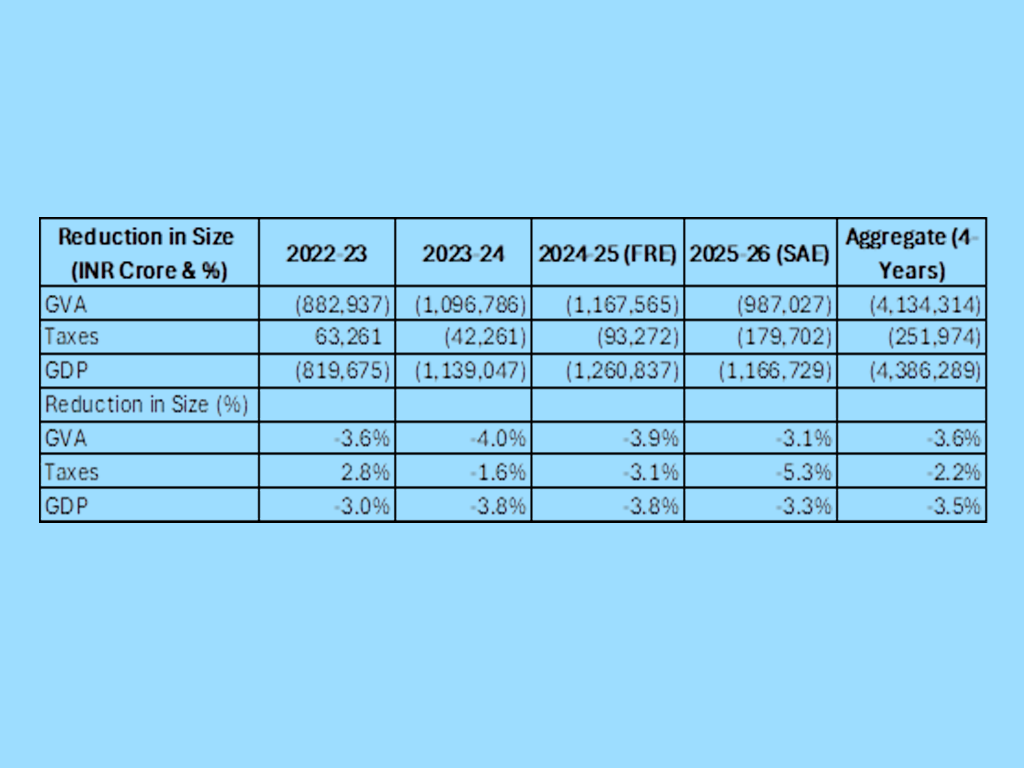
In absolute terms, the decline in Gross Value Added (GVA) is smaller than the decline in Gross Domestic Product (GDP), as GVA declined by INR 41.3 lakh crore and GDP by INR 43.9 lakh crore – the difference is explained by a decline in taxes by 2.5 lakh crore, most of which was in FY 2025-26 (Table 1).
In Table 2 below, we present data on the changes in value at different accounting layers.
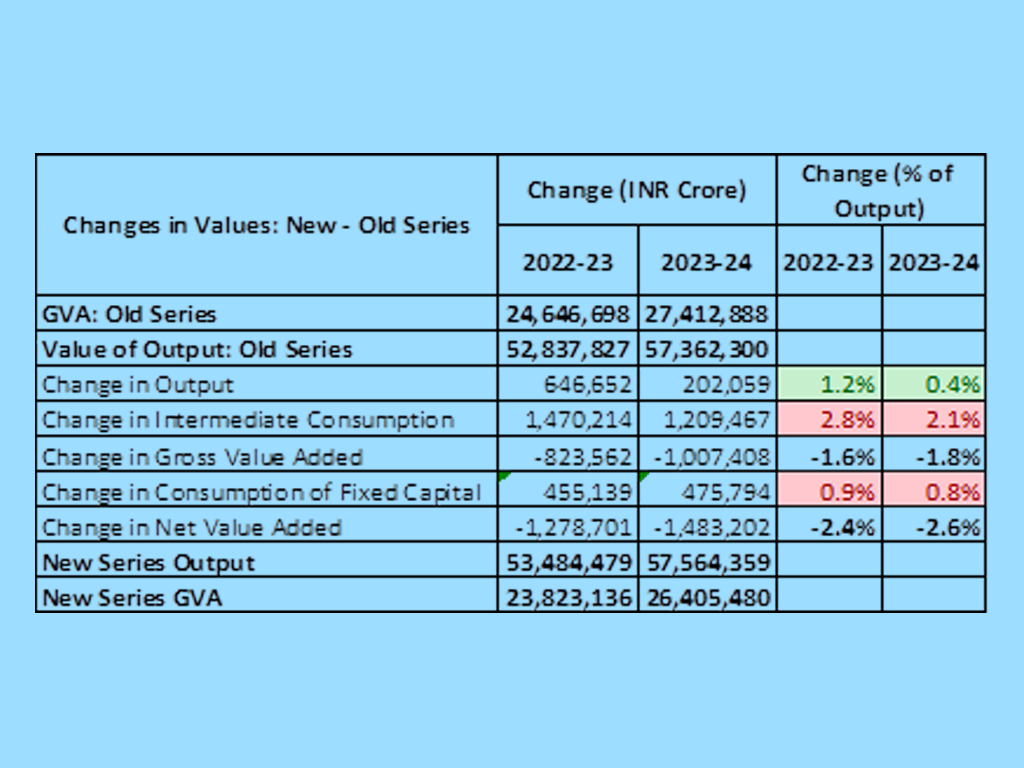
Table 2: Accounting Decomposition of the Change in GVA and NVA
The proximate accounting source of the lower GVA estimate is not a downward revision of output, but a much larger upward revision of the intermediate goods and services used in producing that output. Output is, in fact, revised upward in both years.
In both years, the revised estimate of intermediate consumption is more than 2 per cent higher than in the old series. The increase is concentrated in services, although manufacturing also records a substantial upward revision (Table 3).
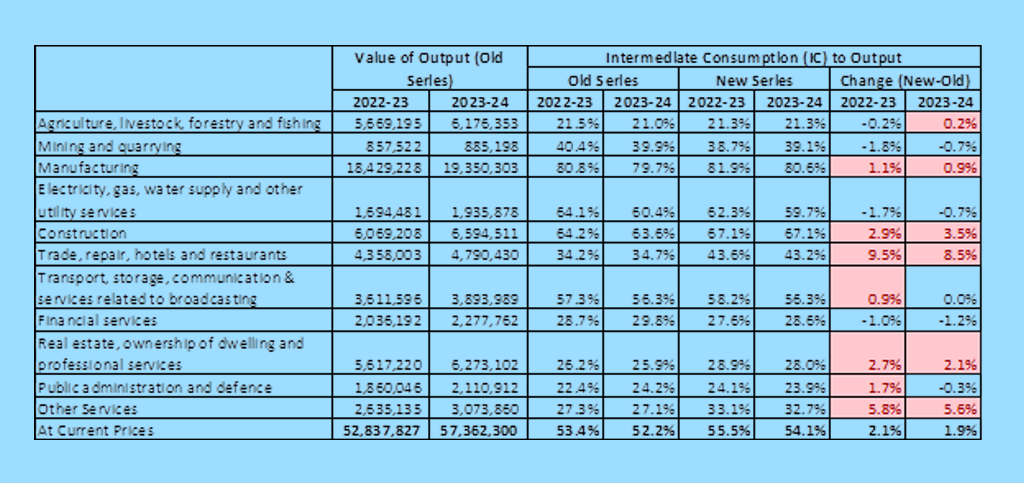
Table 3: Intermediate Consumption by Sector
Construction, trade, repairs and hotels, and real estate, ownership of dwellings and professional services sectors have seen their intermediate consumption go up significantly in the new series.
Do we now have more reliable data on the economic structure that has caused GVA and Net Value Added (NVA) to decline sharply– higher intermediate input intensity of output and higher consumption of fixed capital?
A study of the revised benchmark sources (ASI/NSS enterprise-type benchmarks, supply-use balancing, GST-derived cost structures, or MCA-21 corporate accounts) will be able to tell us if the material and service inputs per rupee of output in the old series were consistently lower than the assumptions embodied in the new series. MOSPI can easily provide us with this reconciliation.
It is also important to ask another set of questions.
We do know that value chains in sectors such as construction, trade, education and healthcare have become increasingly fragmented. A construction project, for example, can involve a developer, an Engineering, Procurement, and Construction (EPC) contractor and separate civil-works, structural, electrical, plumbing, labour, equipment-rental and transport contractors. This is described as the emergence of a contractor-based production ecosystem.
Such an ecosystem can improve specialisation and capability. But it can also multiply inter-firm transactions and purchased services without a proportionate increase in final value added. Its accurate measurement requires consistent coverage of every layer of the chain. Administrative tax data may improve that visibility, while also requiring safeguards against duplicate, circular or non-genuine transactions.
The sharp upward revision to CFC may reflect changes in the estimated volume or composition of the capital stock, revised asset lives and depreciation profiles, better coverage of fixed assets, or some combination of these factors. It may therefore be telling us as much about the revised stock-side representation of the economy as about current production.
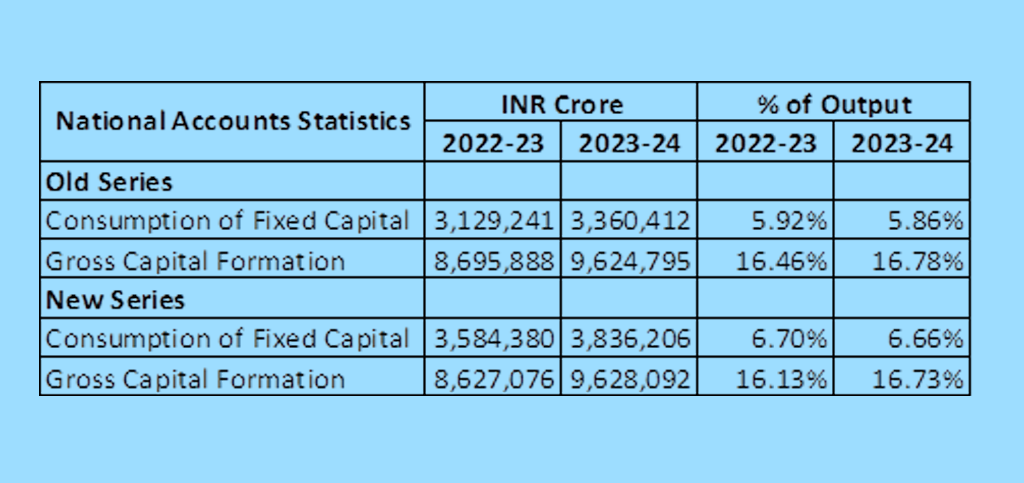
Table 4: Consumption of Fixed Capital
Consumption of fixed capital too has grown across sectors with utilities, mining and quarrying, and public administration experiencing large upward revisions. Some of the biggest upward revisions are in water supply and communication sub-sectors.
Since the National Accounts Statistics (NAS) tables don’t provide CFC data for sub-sectors in financial and other services sectors, it is important that MOSPI reviews the CFC by sub-sector to determine the cause of these large variations.
A major change in CFC level for financial services is possibly explained by increased investment in technology or a higher rate of depreciation, but a large change in CFC for ‘other services’ will need deeper analysis.
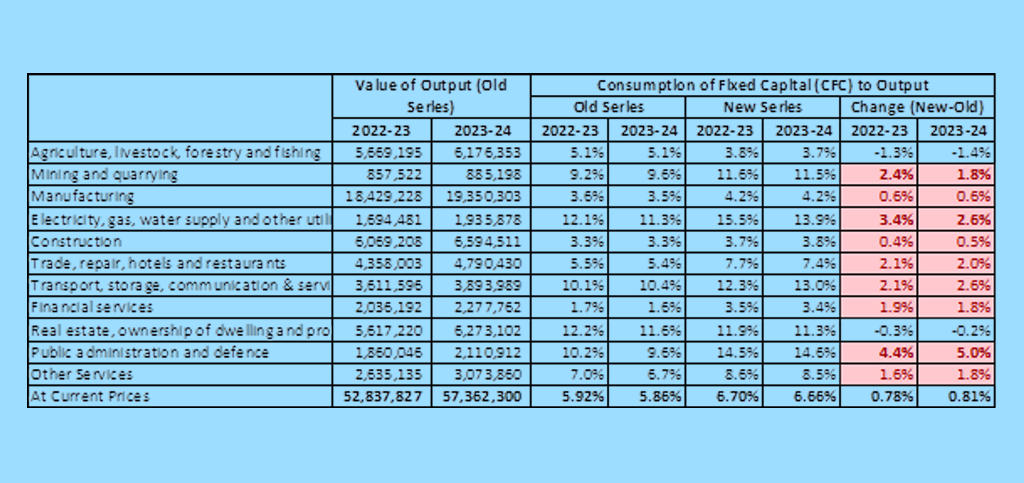
Table 5: Sectoral CFC Revisions and CFC-to-Output Ratios
The PAD (Public Administration and Defence) result is especially revealing.
In 2023-24, GVA is revised downward by ₹62,814 crore while CFC is revised upward by ₹91,577 crore. Because PAD output is largely estimated from costs rather than observed market prices, the combination of lower output and GVA with substantially higher CFC requires a component-level explanation. The higher CFC may reflect a reassessment of the stock, composition or economic life of government assets, rather than additional current economic activity.
The questions, therefore, are:
Our analysis using the KLEMS (Capital, Labour, Energy, Materials, Services) database indicates that capital stock has grown faster than value added, resulting in declining measured capital productivity across a wide range of sectors (Chart 1). The Indian economy has not really been using capital too well, the revised economy is even more capital-intensive and less net-income-generating than the old economy.
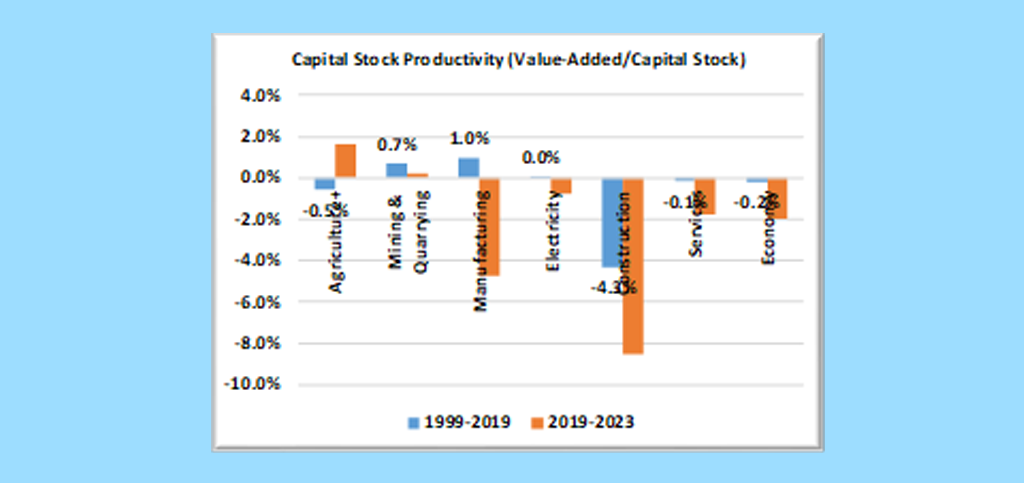
Chart 1: Capital Stock Productivity (Value Added at Current Prices/Capital Stock) by Sector (1999-2023)
An upward revision of INR 4.55-4.75 lakh crore in annual depreciation is not a minor adjustment. It implicitly points either to a very large change in the estimated stock of fixed assets underlying the national accounts or a large revision in the rate at which capital stock is to be depreciated.
Declining capital productivity may have many competing explanations. Capacity may have been created ahead of demand and may eventually achieve higher utilisation.
Alternatively, persistent underutilisation may reflect poor project selection, cost escalation, duplication of assets, procurement inefficiencies, speculative investment, related-party incentives or broader capital misallocation. The national accounts cannot distinguish among these mechanisms, but their relative importance is central to interpreting the revised capital-stock picture.
If capital is not deployed productively, the national accounts will record the expenditure as capital formation; depreciation is recorded through CFC, but the associated increase in GVA may be small.
At the firm level, persistently underutilised capital is likely to be associated with lower asset turnover, weaker cash flow relative to assets and pressure on profitability. In household and commercial property markets, the symptoms may include vacant housing and underutilised commercial real estate. These outcomes cannot be inferred directly from the national accounts, but they provide observable indicators against which the excess-capacity hypothesis can be tested.
The economic question, therefore, is:
Does the revised series reveal a fundamental change in the asset structure of the Indian economy, involving lower capital-stock productivity and more rapid capital consumption?
It is also possible that the statistical system has begun measuring the capital stock and its economic life more completely. The two explanations are not mutually exclusive. Better measurement may be revealing an economic transformation that has already occurred.
The remaining accounting layers are compensation of employees and operating surplus and mixed income. We expect an increase in capital intensity (substitution of labour with capital) to reduce the share of labour in output, and an increase in operating surplus for capital intensive sectors. If the value chain is getting fragmented and there is greater participation of owner-managed businesses, we should see an increase in mixed income.
Table 6 shows that compensation of employees is lower in the new series by approximately INR 7.2 lakh crore over the two years. This alters the measured labour share of output and raises questions about how the gains from growth have been distributed between labour, capital and owner-managed enterprises. The result may help explain why perceptions of household economic conditions do not always move in line with headline GDP growth.
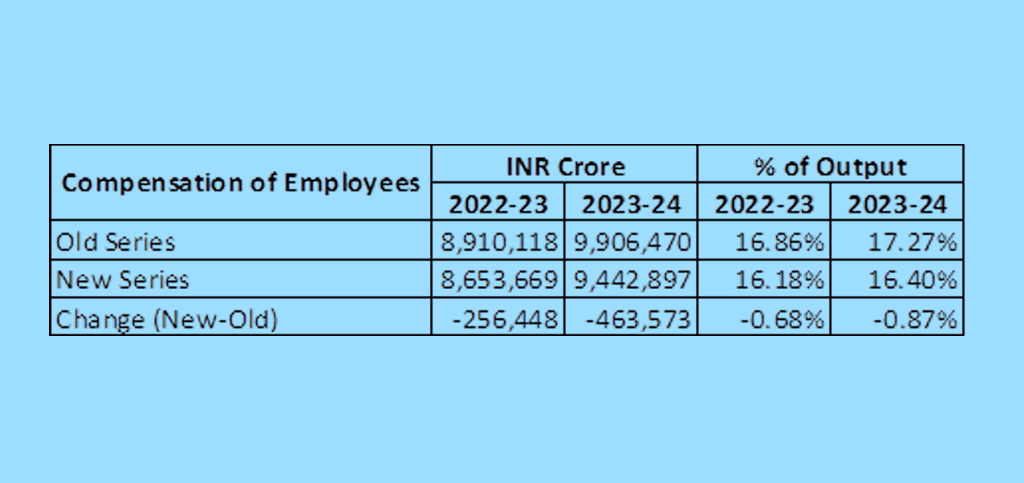
Table 6: Changes in Compensation of Employees
Operating Surplus and Mixed Income
The decline in OS/MI is larger than the decline in employee compensation. Several mechanisms could produce this pattern (Table 7). The new benchmarks may attribute less mixed income to unincorporated enterprises; smaller businesses may be generating lower margins; or fragmented value chains may have changed the distribution of value between lead firms and contractors.
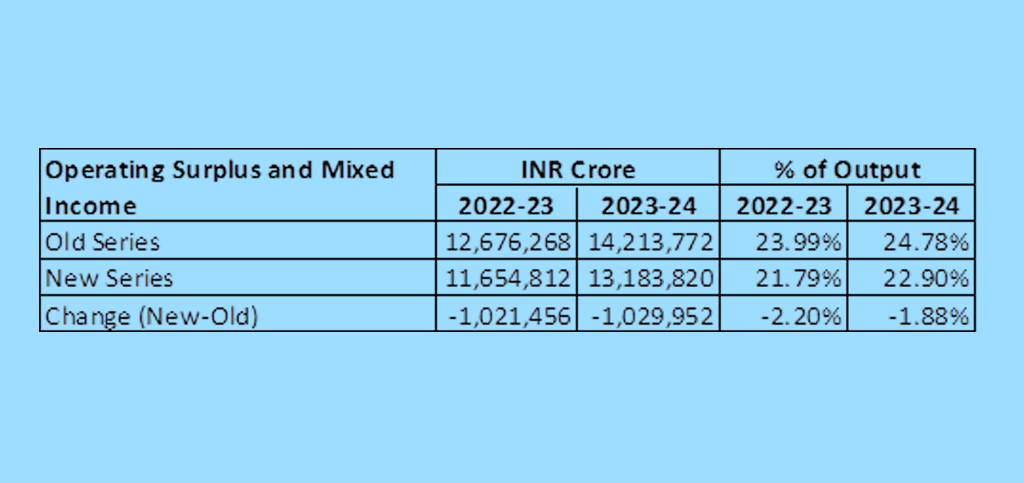
Table 7: Changes in Operating Surplus and Mixed Income
A decline in compensation of employees and operating surplus needs further study to identify the causes and determine possible economic and business strategies that can help improve capital productivity, compensation for employees and operating surplus. We may also need to focus on material productivity, if we find that an increase in intermediate consumption is not being explained by improved capture of data.
We see revisions as a possible change in the statistical view of India’s economic structure, beyond the reconciliation of numbers in two series. Hypotheses that need to be tested and the questions that we need to ask are:
Seen together, the revisions do not point towards a single isolated measurement change. They depict an economy in which more of gross output is absorbed by intermediate inputs, more of gross value added is absorbed by capital consumption, and less net income is recorded as compensation or operating surplus and mixed income. These changes may arise from revised data and methods, from changes in the organisation of production and the capital stock, or from interaction between the two. The national accounts do not identify a unique mechanism, but neither are they economically silent.
The most important task now is not to defend or criticise the new GDP revision, but to explain it.
A revision of this magnitude should trigger a serious inquiry into how India’s production structure has changed since the assumptions embedded in the previous benchmark became obsolete. Until that explanation exists, there is a risk that policy will continue to rely on indicators whose economic interpretation is not fully understood.
Also Read:
7.8% growth, 1% FDI: Questions over one, worries over the other
7.8% GDP growth, 3% smaller economy: Does PM Modi’s ‘herculean feat’ add up?
India in 2050: The world’s second-largest economy—and its hundredth-poorest nation



