Published May 02, 2026 | 8:00 AM ⚊ Updated May 02, 2026 | 8:00 AM


Voters at a polling booth in Tamil Nadu.

Synopsis: An analysis of preliminary vote counts from the 23 April Tamil Nadu Assembly polls shows that the 85 percent turnout broadly follows the steady growth seen in 2016 and 2021, rather than indicating any exceptional surge. District-wise patterns are largely consistent with previous elections, but the figures may be partly flattered by a reduced electorate after the Special Intensive Revision, which brought down the total number of voters to 5.73 crore from 6.41 crore.
The record turnout of 85 percent at the 23 April Tamil Nadu Assembly polls is largely in line with the growth seen in the previous two elections in 2021 and 2016, an analysis of preliminary polling data shows.
In the immediate aftermath of the polls, the Election Commission of India claimed the state saw unprecedented voter participation. TVK leaders, from its president Vijay to party cadres, went further and said their entry into politics drew previously disengaged voters out of their homes and drove this surge.
But the ‘historic’ turnout came against a reduced electorate after the Special Intensive Revision (SIR) of electoral rolls between December 2025 and January 2026. Before this exercise, the state had 6.41 crore voters; after the revision, the number dropped sharply to 5.73 crore.
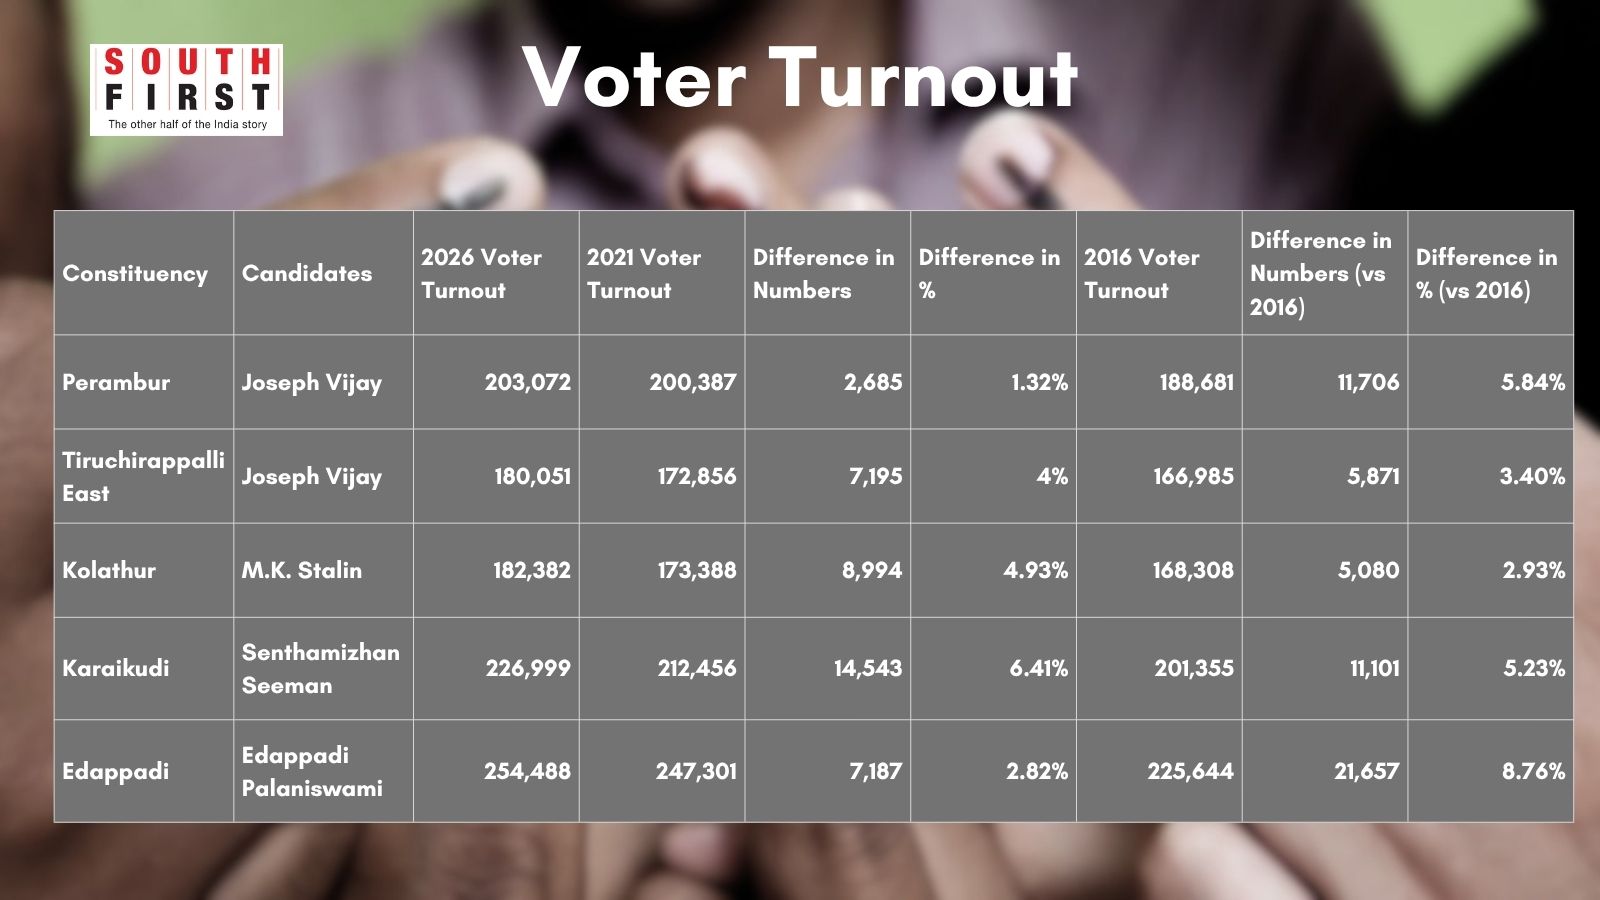
Voter Turnout.
Consider Kolathur, where Chief Minister and DMK president MK Stalin contested. A total of 1,82,382 votes were polled in 2026, up from 1,73,388 in 2021—an increase of 8,994 votes (4.93 percent). In 2016, 1,68,308 votes were cast, so the 2021 increase over 2016 was 5,080 votes (2.93 percent). The growth across the three elections is consistent, not exceptional.
Now compare this with constituencies linked to Vijay, who has claimed a statewide surge.
In Perambur, total votes polled were 1,88,681 in 2016, 2,00,387 in 2021, and 2,03,072 in 2026. The increase this time is just 2,685 votes, far lower than the 11,706-vote jump between 2016 and 2021, when Vijay was not in the fray.
Tiruchirappalli East shows a similar pattern. Votes rose from 1,66,985 (2016) to 1,72,856 (2021) and 1,80,051 (2026). The latest increase is 7,195 votes, comparable to the 5,871-vote rise in the previous cycle—a continuation of the trend, not a surge.
In Karaikudi, where Naam Tamilar Katchi leader Seeman contested, votes increased from 2,12,456 in 2021 to 2,26,999 in 2026, a jump of 14,543 votes.
In Edappadi constituency in Salem district, where Leader of Opposition Edappadi K Palaniswami contested, growth slowed. The increase was 21,657 votes in 2021 over the previous election, but only 7,187 votes in 2026. Total votes polled this time stood at 2,54,488.
Taken together, the figures show no clear evidence of a uniform or extraordinary spike in voter participation.
Also Read: Think 85% turnout in Tamil Nadu polls 2026 means ‘wave election’?
Karur recorded the highest turnout, with 7,89,056 votes polled (92.65 percent). This comes after a stampede at a TVK campaign event in September 2025 that killed 41 people, after which party leaders said voters would respond strongly in the election.
Some cadres now attribute Karur’s high turnout to a “Vijay wave”. But the district has long seen strong participation. In 2021, it recorded 7,62,782 votes, so the increase this time is only 26,274 votes.
Chennai shows this even more clearly. The city saw one of the sharpest cuts in voter rolls after the SIR, dropping from around 40 lakh voters to 28 lakh.
Despite this, total votes polled across its 16 constituencies rose only marginally, from 24,16,815 in 2021 to 24,48,186 in 2026. That is an increase of just 31,371 votes, which points to a routine rise, not a surge.
Compared with 2016, the increase is smaller. Across the same 16 constituencies, the 2026 election recorded only 14,316 more votes than in 2016.
At the other end, Kanyakumari recorded the lowest turnout, with 11,48,215 votes (75.52 percent), compared with 11,00,185 in 2021.
Districts with highest polling:
|
District |
2026 Voter Turn Out |
2021 Voter Turn Out |
2016 Voter Turn Out |
|
Karur |
7,89,056 |
7,62,782 |
7,04,030 |
|
Salem |
25,23,226 |
24,14,875 |
22,60,616 |
|
Namakkal |
11,93,748 |
11,73,189 |
11,09,749 |
|
Chennai |
24,48,186 |
24,16,815 |
24,33,870 |
|
Madurai |
20,07,773 |
19,20,405 |
17,93,049 |
Karur topping the state is not new. It also recorded the highest turnout in the previous election (83.92 percent).
Chennai, by contrast, had one of the lowest turnout rates in 2021 at 59 percent, and is now said to have risen sharply to 83.68 percent. But in absolute terms, that rise is only 31,371 votes.
Districts with lowest polling:
|
District |
2026 Voter Turn Out |
2021 Voter Turn Out |
2016 Voter Turn Out |
|
Kanniyakumari |
11,48,215 |
11,00,185 |
10,27,425 |
|
Sivaganga |
8,57,336 |
8,28,327 |
7,74,909 |
|
Ramanathapuram |
8,67,844 |
8,19,267 |
7,51,936 |
In Kanyakumari, the 2021 election saw an increase of over 70,000 votes compared with 2016. In 2026, that rise slowed to about 48,000 votes. The pace of increase has clearly declined.
(Edited by Muhammed Fazil.)
