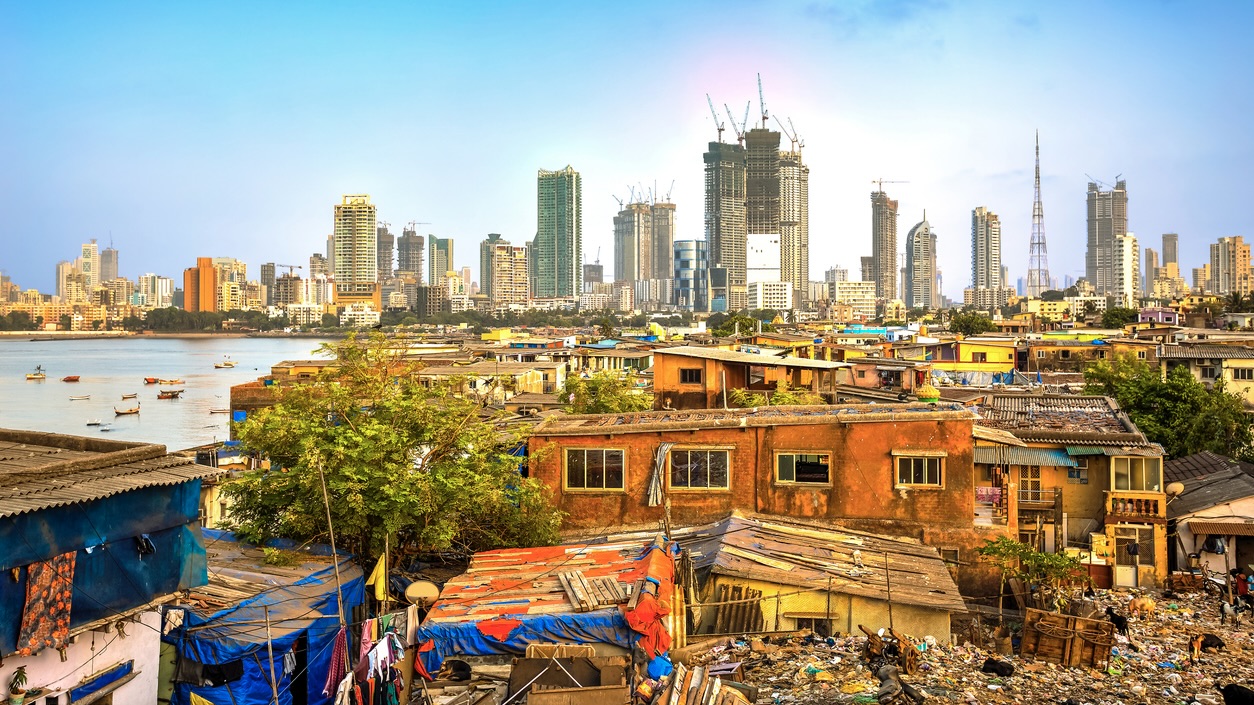
India was first classified as a lower-middle-income nation from low-income in the fiscal year 2009. As of 2025, India is among the largest economies with a nominal GDP of approximately $4.19 trillion, according to the International Monetary Fund.
Published Jul 30, 2025 | 6:23 PM ⚊ Updated Jul 30, 2025 | 6:23 PM

India’s poverty rate fell from 57.7 percent in 2011–12 to 23.9 percent in 2022–23.
Synopsis: India continues to be classified as a lower middle-income country by the World Bank, based on a revised poverty line of $4.20 per person per day at 2021 Purchasing Power Parity, the Union government informed parliament on Wednesday. India’s overall poverty rate fell from 57.7 per cent in 2011–12 to 23.9 per cent in 2022–23, while five states – Uttar Pradesh, Maharashtra, Bihar, West Bengal and Madhya Pradesh – accounted for 54 percent of the country’s extreme poor.
The Union government has confirmed that India continues to be classified as a lower middle-income country (LMIC) by the World Bank, based on an updated poverty line of $4.20 per person per day at 2021 Purchasing Power Parity (PPP).
In an unstarred question (No. 1641), Communist Party of India (CPI) MPs K Subbarayan (Tiruppur) and V Selvaraj (Nagapattinam) asked in the Lok Sabha whether the poverty line had been fixed at ₹4.20 per person per day, and requested rural and urban poverty estimates for 2011–12 and 2022–23, including state-wise data.
In a written reply on Wednesday, Minister of State (Independent Charge) Rao Inderjit Singh said: “The World Bank has recently revised the international poverty lines and set the threshold for lower-middle-income countries (LMICs) at $4.20 per day, based on 2021 Purchasing Power Parities (PPPs). India is currently classified as an LMIC.”
India was first classified as a lower-middle-income nation from low-income in the fiscal year 2009. As of 2025, India is among the largest economies with a nominal GDP of approximately $4.19 trillion, according to the International Monetary Fund.
Citing the revised threshold, the minister informed Parliament that using the 2021 PPP-adjusted LMIC poverty line of $4.20 per day, India’s poverty rate fell from 57.7 percent in 2011–12 to 23.9 percent in 2022–23. Under the extreme poverty line of $3.00 per day (2021 PPP), the rate declined from 27.1 percent to 5.3 percent during the same period.
Under the earlier 2017 PPP benchmark:
These figures were sourced from the World Bank’s April 2025 Poverty and Equity Brief, which draws on data from the 2022–23 Household Consumption Expenditure Survey, updated PPP benchmarks, and harmonised methodologies.
Using the same 2017 benchmarks, the World Bank estimated that 171 million people were lifted out of extreme poverty, and 378 million from LMIC-level poverty between 2011–12 and 2022–23.
In rural areas, extreme poverty dropped from 18.4 percent to 2.8 percent, and LMIC poverty from 69 percent to 32.5 percent. Urban areas saw improvements as well, with extreme poverty declining from 10.7 percent to 1.1 percent, and LMIC poverty falling from 43.5 percent to 17.2 percent.
In spite of the apparent decrease in overall poverty, the World Bank report noted continued demographic and regional disparities.
Rural poverty remained significantly higher at 32.5 percent, compared to 17.2 percent in urban areas. Poverty levels were highest among individuals without formal education (35.1 percent) and among women (28.8 percent).
Five states – Uttar Pradesh, Maharashtra, Bihar, West Bengal and Madhya Pradesh – accounted for 54 percent of India’s extreme poor in 2022–23.
Notably, the Centre’s response in Parliament on Wednesday doesn’t provide state-wise data.
The World Bank’s Multidimensional Poverty Measure (MPM), which assesses deprivations in sanitation, education, water and electricity (but does not include nutrition or health), estimated the national poverty rate at 15.5 percent in 2022–23, down from 53.8 percent in 2005–06.
The World Bank also noted that changes in methodology introduced in the 2022–23 consumption survey, such as the use of a modified mixed reference period and deflated welfare aggregates, had improved data quality. However, these adjustments also complicated comparisons with earlier years.
The real value of poverty thresholds has also changed under the 2021 PPP benchmark:
The report cautioned that inequality may still be underestimated, owing to limitations in available data.
While the consumption-based Gini index improved from 28.8 in 2011–12 to 25.5 in 2022–23, the World Bank report cited the World Inequality Database’s earlier findings about India’s worsening income inequality, with income Gini rising from 52 in 2004 to 62 in 2023.
“There is a stark gap in earnings,” the World Bank noted. “The median earnings of the top 10 percent are 13 times higher than the bottom 10 percent in 2023–24.”
India has also shown improvements in employment indicators. “Employment growth has outpaced the working-age population since 2021–22. Employment rates, especially among women, are rising,” the World Bank report said.
Urban unemployment dropped to 6.6 percent in the first quarter of FY24/25, the lowest since 2017–18.
However, youth unemployment remains high at 13.3 percent, rising to 29 percent among tertiary-educated graduates.
Most notably, the informal sector continues to be the dominant sector, with only 23 percent of non-farm jobs classified as formal. The female employment rate remains low at 31 percent, with a gender gap of 234 million fewer women in paid work.
(Edited by Dese Gowda)
