

Published Nov 09, 2026 | 6:16 PM ⚊ Updated Nov 09, 2026 | 6:16 PM

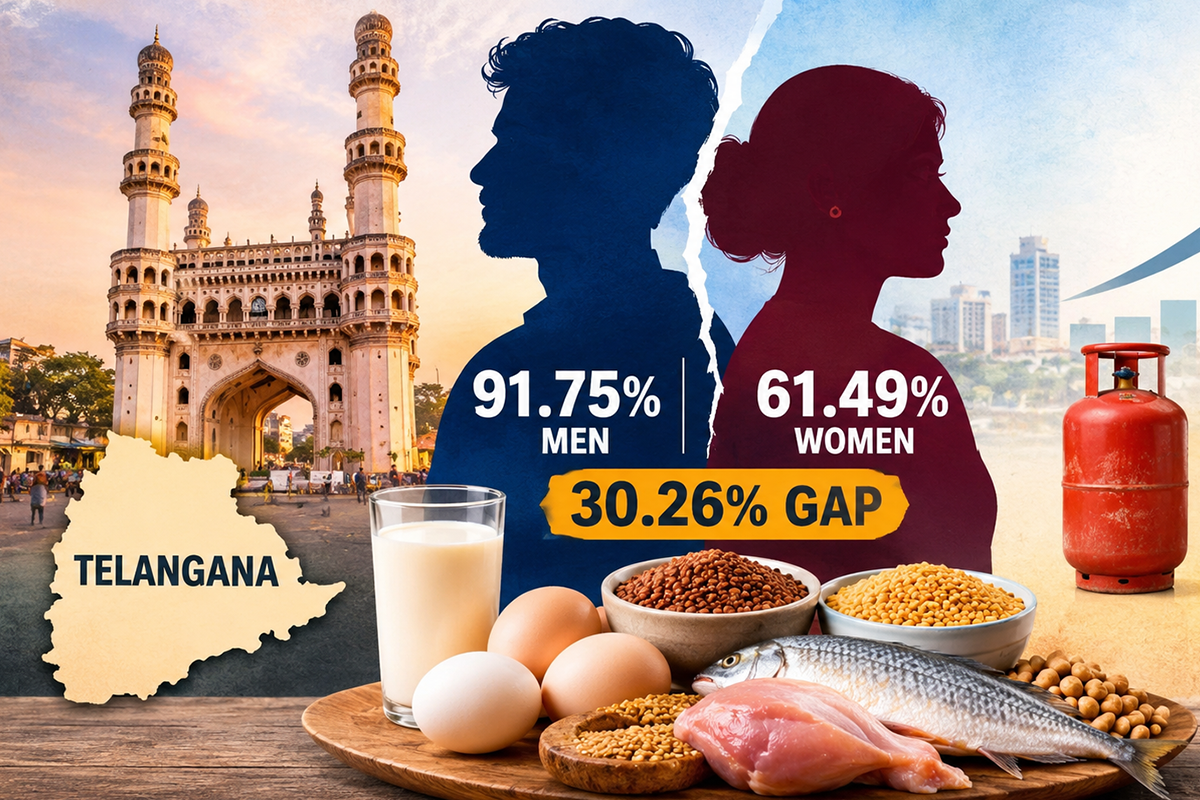
The difference of 30.26 percentage points is the highest among the states examined.

Synopsis: An SBI Research report has found that Telangana has India’s widest gender gap in household protein-food diversity, while Keralam recorded the narrowest gap and the highest protein-food spending among southern states. The analysis also highlighted regional differences in ready-to-eat food expenditure, LPG use, household consumption and online food purchases.
Telangana has the widest gender gap in the consumption of selected protein-rich food categories among Indian states, with 91.75% of men reporting consumption across three to four categories, compared with 61.49% of women, according to a State Bank of India (SBI) Research report.
The difference of 30.26 percentage points is the highest among the states examined. Odisha recorded the second-largest gap at 22.75 percentage points, followed by Chhattisgarh at 15.25 percentage points.
Among southern states, Andhra Pradesh recorded a gap of 11.86 percentage points, Karnataka 8.66, Tamil Nadu 7.92 and Kerala 5.44. Kerala had the narrowest difference between men and women in the southern region.
The report, India’s Consumption Journey, analysed household consumption patterns using data from the National Statistics Office’s Household Consumption Expenditure Survey (HCES) 2023-24.
“Consumption of protein-rich items reveals considerable gender-based variation in the prevalence of higher diversity across the selected protein-rich food categories,” the report said.
It added that “male-coded observations record higher percentages than female-coded observations in most states, with particularly large gaps in Telangana, Odisha, Punjab and Chhattisgarh”.
The report attributed these differences to household food preferences, affordability and access to diverse food items.
Kerala recorded the highest expenditure on selected protein-rich food items among the five southern states, at ₹1,134. Karnataka followed at ₹1,045, Andhra Pradesh at ₹979, Telangana at ₹959 and Tamil Nadu at ₹923.
At the national level, Sikkim and Goa recorded the highest average expenditure on selected protein-rich foods, followed by Haryana. Odisha, Chhattisgarh and West Bengal reported the lowest levels.
“There exist considerable interstate variations in household expenditure on protein-rich food items, indicating disparities in dietary consumption patterns across India,” the report said.
It added that the differences “may reflect variations in household purchasing power, food prices and dietary preferences, highlighting the uneven expenditure patterns on protein-rich food items across states”.
Telangana households allocated 16.3% of their food expenditure towards served or ready-to-eat food, the highest share recorded among states. Tamil Nadu, Meghalaya and Karnataka were among the other states with relatively high expenditure shares in this category.
The report also identified differences in food spending according to household composition. Families with a higher proportion of elderly members allocated relatively more towards milk, fruits and vegetables, while households with a larger share of children spent more on milk products, served food and packaged food.
“A large part of Indian households still prefer a value-based system of respect for elders in the family and care for younger members in the family consistent with the traditional beliefs,” the report said.
It added that households with more elderly members allocated relatively more towards milk, fruits and vegetables, while families with young children spent more on milk products, served and packaged food.
Livelihood patterns also influenced spending. Households dependent on regular wages allocated 2.5 percentage points more of their food expenditure towards served food than self-employed households. Casual labour households spent relatively more on cereals and eggs, fish and meat, but less on milk and fruits.
Kerala and Telangana were among the highest-spending states nationally. Kerala recorded an average monthly per capita consumption expenditure (MPCE) of ₹15,917, the second-highest among states, while Telangana ranked fourth at ₹15,391.
Tamil Nadu recorded an MPCE of ₹13,188, Karnataka ₹12,541 and Andhra Pradesh ₹12,307.
Haryana topped the national rankings, followed by Kerala, Goa and Telangana. Bihar and Uttar Pradesh reported comparatively lower consumption levels.
The report found that food accounted for 32.82% of total household consumption expenditure, while durable goods accounted for 33.69% and consumables and services made up 33.49%.
It described this as a shift in household expenditure from food essentials towards non-food items and services.
Andhra Pradesh recorded the highest overall LPG usage among the five southern states, at 87.8%, followed by Telangana at 84.4%, Tamil Nadu at 83.5%, Karnataka at 82.6% and Kerala at 66.3%.
Telangana showed a distinct rural-urban pattern, with LPG usage at 95.3% in rural areas compared with 73% in urban areas. In the other four southern states, urban usage was higher than rural usage.
Andhra Pradesh reported 86.9% rural and 89.7% urban usage. Karnataka recorded 81.5% and 84.1%, respectively, while Tamil Nadu reported 81.4% and 85.8%. Kerala had the lowest usage in the region, at 58.5% in rural areas and 74.1% in urban areas.
The report found that 45.6% of Indian households used online purchase or payment platforms for at least one consumption item, while 54.4% reported no such adoption.
Digital purchases were concentrated in consumables and services, accounting for 39.68%, followed by durable goods at 23.3%. Food purchases accounted for only 7.1%.
Among food categories, online adoption was highest for groceries at 4.29%, followed by served processed food at 2.62% and packaged processed food at 1.65%. Purchases remained limited for vegetables (1.32%), fresh fruits (1%), dry fruits (0.62%) and eggs, fish and meat (0.59%).
“Online purchases remained limited for Vegetables, Fresh fruits, Dry fruits and eggs, fish and meat, reflecting continued reliance on traditional retail channels for perishable items and the fact that people still prefer to visit markets for such food products,” the report said.
Digital adoption also varied according to household spending. While 25.3% of households in the bottom consumption quintile used online purchase or payment platforms, the proportion increased to 69.5% in the top quintile.
Households using digital platforms recorded 7.5% higher MPCE than non-adopting households after the analysis controlled for household characteristics and state- and district-level factors. Their food expenditure was 21.4% higher, while expenditure on services and durable goods was 23.4% and 24.5% higher, respectively.
The analysis covered 261,953 households, including 154,357 rural and 107,596 urban households, surveyed between August 2023 and July 2024.
Also Read:
A schoolgirl and a fit marathon runner: What is behind sudden cardiac deaths in the young?
(Edited by R Rajesh Kumar.)



